
Yes, home prices are dropping in North Texas, but not everywhere, and not by the same amount. The typical home in the Dallas-Fort Worth metro is worth $358,242, according to Zillow’s September 2026 data. That’s 8.6% below the August 2022 peak and 2.0% lower than a year ago, while the U.S. typical home hit a new record high (+1.2% over the year).
We tracked typical home values for all 84 cities Realust covers in Collin, Denton, Dallas and Rockwall counties, from each city’s peak to today. The result is a clear split. Fast-growing, new-build towns on the northern edge fell the most, led by Princeton at -25.8%. Built-out, close-in and luxury cities barely moved, and 5 are at all-time highs. The median city is down 8.5%.
Mortgage rates explain a lot of it. They’re also why, in many cities, the monthly payment on a typical home is higher than at the peak even though prices are lower. Use the map, find your city in the table below, and read on for what’s behind the numbers.
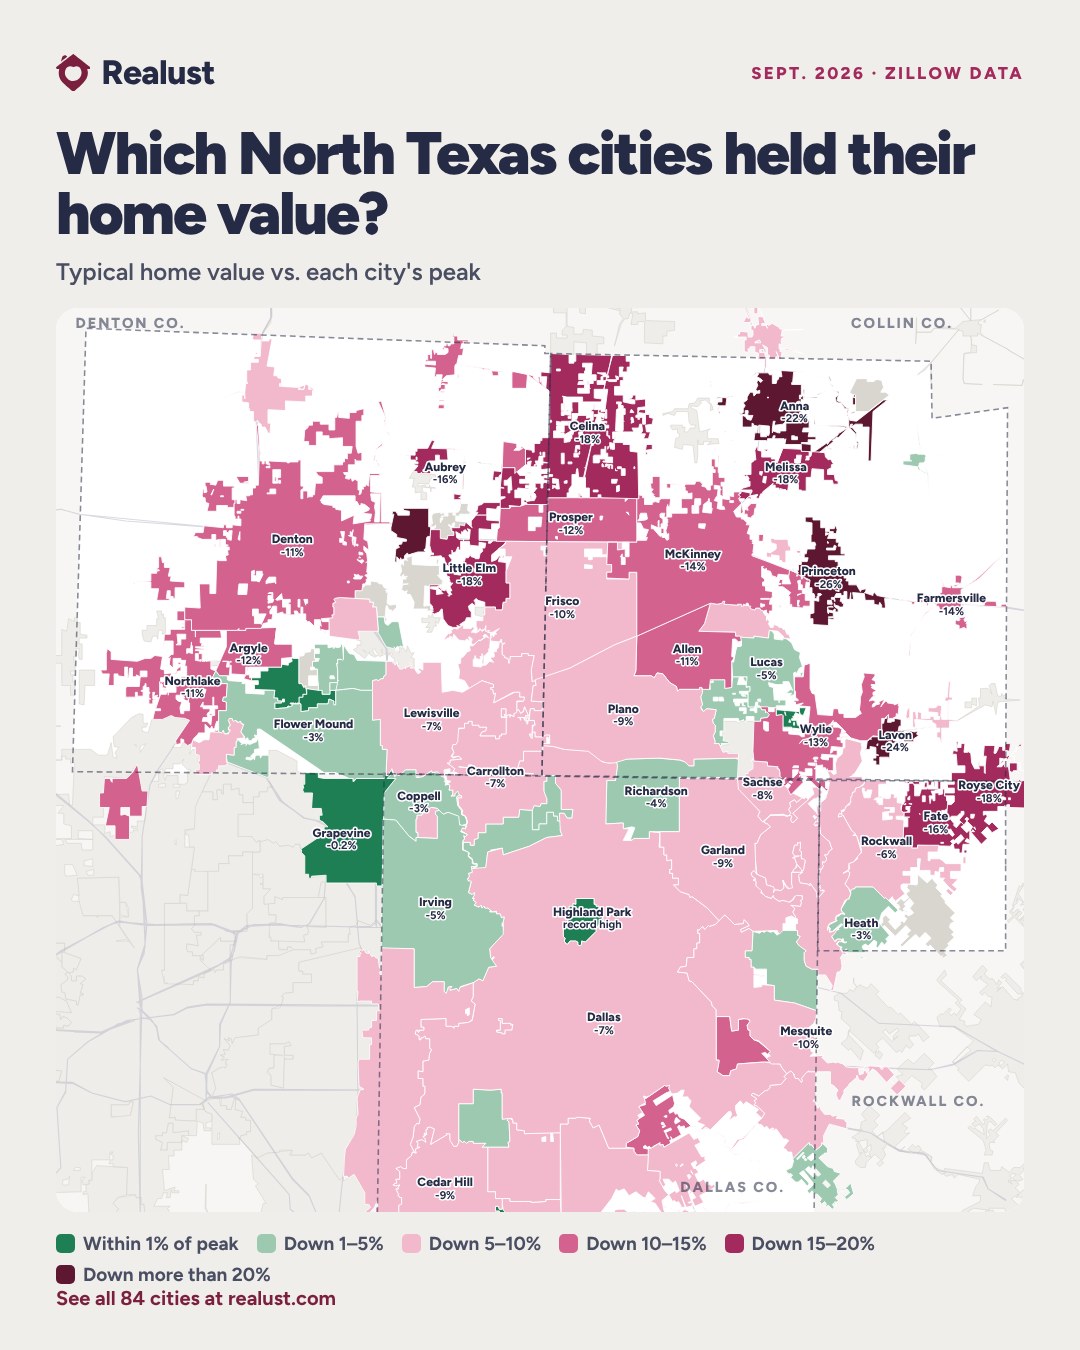
The map: which North Texas cities held their value
Tap or hover a city. Shading compares each city’s Zillow Home Value Index (typical home, all homes, seasonally adjusted) in September 2026 with its highest month since 2018. Gray cities don’t have enough sales for a Zillow city index. Boundaries: U.S. Census Bureau TIGER/Line. Open the full-size map.
Read the map from the outside in. The darkest cities sit on the growth edge: Princeton, Lavon and Anna in Collin County, Cross Roads and Little Elm in Denton County and Royse City and Fate in Rockwall County. The green ones are mostly older, land-locked suburbs and estate towns close to Dallas, from Highland Park and University Park to Grapevine, Coppell and Flower Mound.
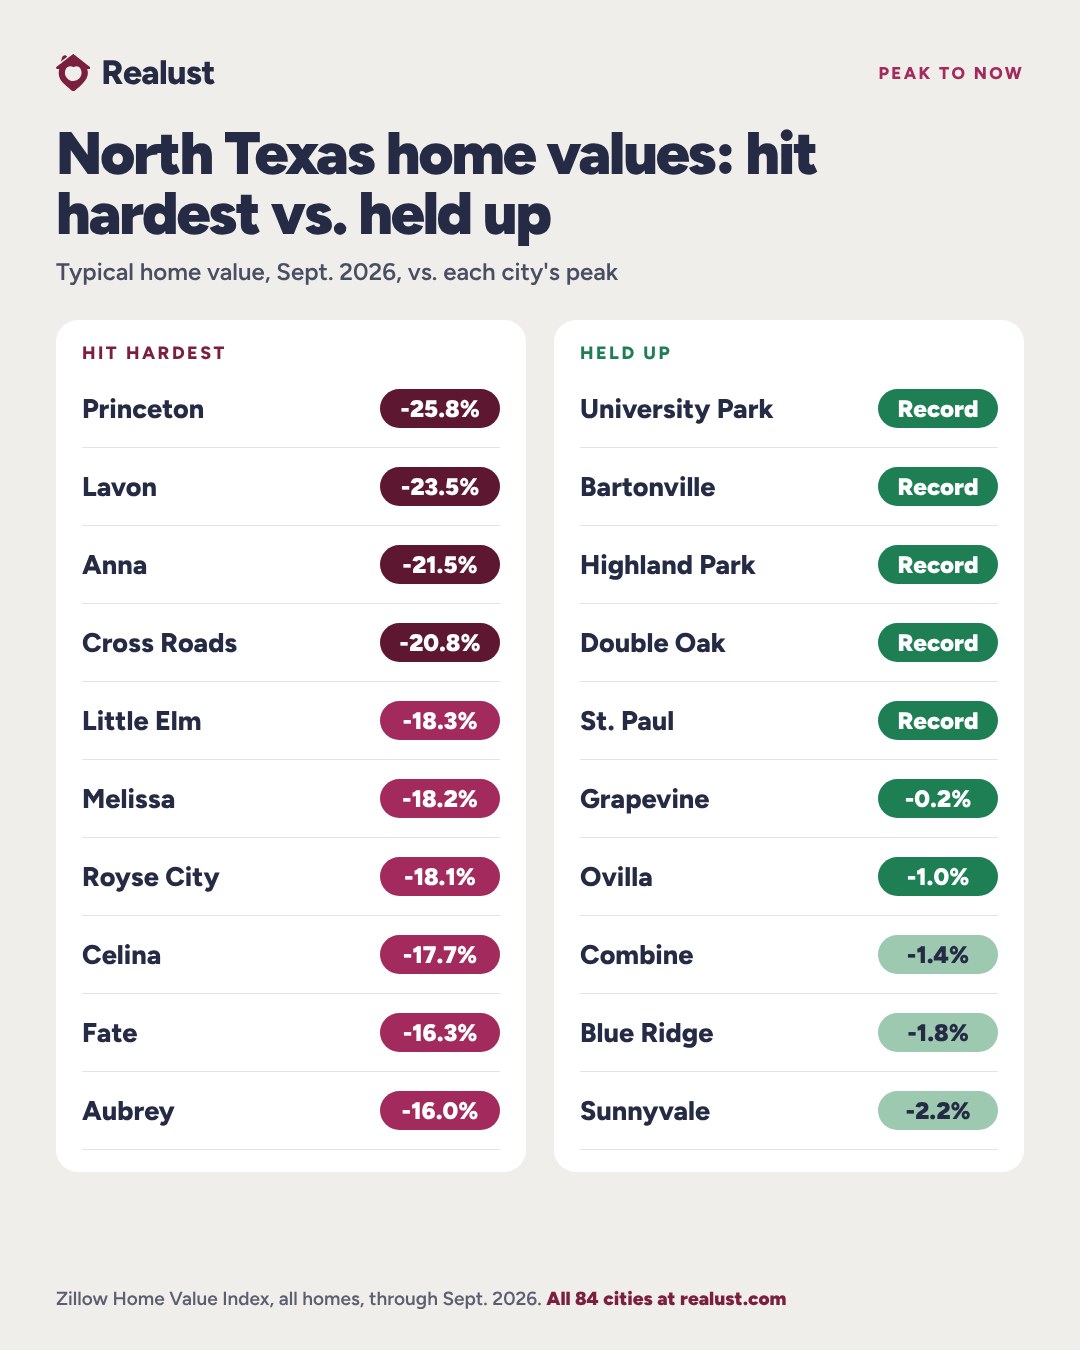
The 15 cities hit hardest
Typical home value, peak month to Sept. 2026. All 15 peaked between July and Sept. 2022. Source: Zillow Home Value Index.
Every city on this list peaked in summer 2022, right as mortgage rates jumped from about 3% to over 5%. Most of them have one thing in common: lots of new houses. When builders have hundreds of finished homes to sell, they compete on price and incentives, and resale homes nearby have to compete with them. Zillow’s median sale price for new construction in the DFW metro fell from $456,960 in June 2022 to $375,585 in Aug. 2026.
Princeton is the clearest example. Its typical home went from $381,709 in Aug. 2022 to $283,150 in Sept. 2026, a $98,559 drop. It is still 16% above where it was in January 2020, and it’s one of the most-searched housing markets in Texas right now. The same pattern runs through Anna, Melissa and Celina, where whole master-planned communities are still filling in. In Celina, home values are down 17.7% even though the population roughly tripled in five years.
The cities that held up (or kept climbing)
Typical home value vs. peak, Sept. 2026. “High” = Sept. 2026 is the city’s highest month on record. Source: Zillow Home Value Index.
5 cities are at record highs: University Park, Bartonville, Highland Park, Double Oak, St. Paul. Grapevine is within 1% of its January 2025 peak. What they share is the opposite of the hardest-hit list: little room to build. These cities are mostly built out, so new supply can’t undercut existing homes. Many also have estate-size lots or top-rated school districts, and their buyers are less sensitive to rates.
Look at the peak months, too. Most cities in this group didn’t peak in 2022 at all. Flower Mound, Highland Village, Coppell, Trophy Club and Grapevine hit new highs in early 2025 and have slipped only a few percent since.
Two different peaks: 2022 vs. 2024–25
Typical home value, change since Jan. 2020. Source: Zillow Home Value Index (smoothed, seasonally adjusted), through Sept. 2026.
- 46 cities peaked in 2022. That’s most of Collin and Denton counties and the outer ring. Prices topped out as rates spiked, and they’ve been sliding since, slowly in places like Frisco (-9.7%) and steeply in places like Princeton.
- 25 cities peaked in 2024 or 2025. These include Plano, Dallas, Irving, Carrollton, Richardson and Garland. They dipped in late 2022, recovered to new highs as the market steadied, then started falling again. Plano is down 8.8% from its May 2024 peak.
- 6 cities peaked in 2026: University Park, Bartonville, Highland Park, Double Oak, St. Paul, Combine. They never really had a down cycle.
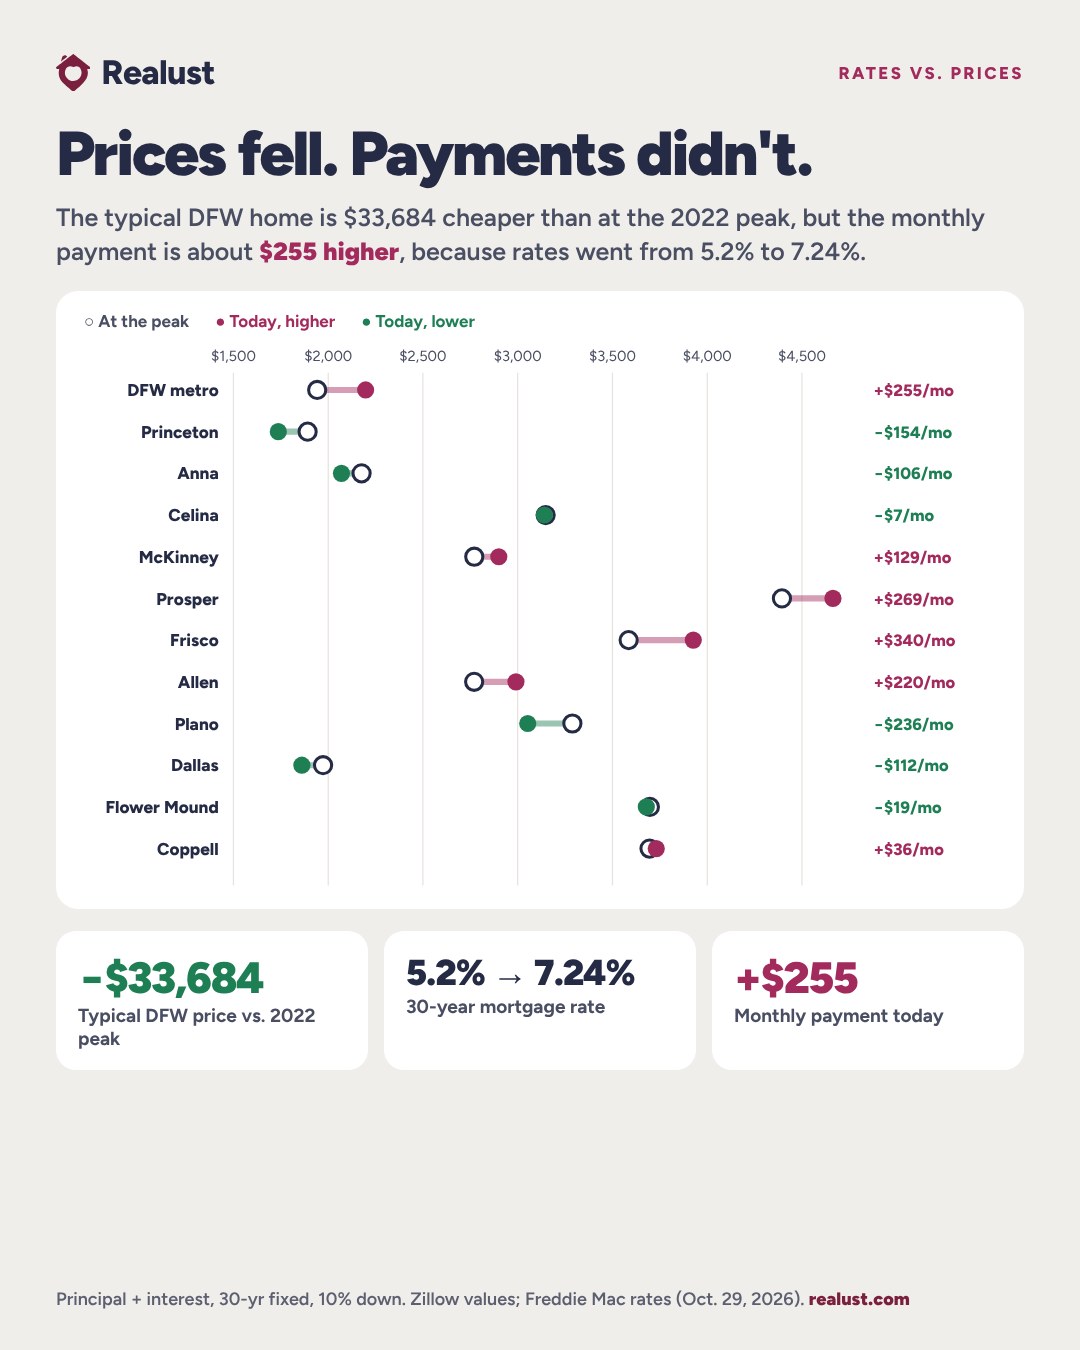
Mortgage rates: prices fell, payments didn’t
Typical home value: Zillow Home Value Index, Dallas-Fort Worth metro, monthly through Sept. 2026. Rates: Freddie Mac Primary Mortgage Market Survey, monthly average through Oct. 2026.
The 30-year fixed rate averaged 2.7% in January 2021. By the summer of 2022 it was over 5%, and it peaked at 7.79% in October 2023. Early this year it looked like relief was coming, with rates down to 5.98% in late February 2026, the lowest in more than three years. Since then they’ve climbed again, rising seven weeks in a row to 7.40% on Oct. 8, and were 7.24% on Oct. 29, per Freddie Mac.
Economists point to rising long-term Treasury yields, inflation worries and heavy federal borrowing. Mortgage rates follow the 10-year Treasury yield more than they follow the Federal Reserve. Higher rates shrink how much house a given monthly budget can buy, and that pushes prices down, most of all where there’s plenty of inventory.
Principal and interest only, 30-year fixed, 10% down. Peak payment uses the Freddie Mac monthly average rate in each city’s peak month. Today uses Sept. 2026 values and the Oct. 29, 2026 rate of 7.24%. Taxes and insurance not included.
This is the part most price-drop headlines miss. Across the DFW metro, the typical home costs $33,684 less than at the Aug. 2022 peak, but the monthly principal and interest is about $255 more, because the rate went from 5.22% to 7.24%. In Frisco, Prosper and Allen, payments are up $200 to $340 a month even with prices 10–12% lower. Only the cities that fell the furthest, like Princeton and Anna, or the ones that peaked in 2024 when rates were already around 7%, like Plano and Dallas, cost less per month today.
So both sides feel stuck: buyers see payments that haven’t come down, and owners see their home worth less than the neighbor’s 2022 sale. Rates are the lever. On a $400,000 loan, every 1-point drop in the rate cuts the payment by about $270 a month.
Is it a buyer’s market in Dallas right now?
By almost every measure Zillow tracks, North Texas buyers have more leverage than at any time in years. Here’s the DFW metro in June 2022, at the height of the frenzy, compared with today:
Zillow Research, Dallas-Fort Worth metro, Sept. 2026 (sale-to-list and new construction: Aug. 2026). Forecast published October 2026.
More than a third of DFW listings have had a price cut, well above the national share. Homes take 64 days on average to go under contract, and the typical sale closes about 2% under the list price. For buyers, that means room to negotiate on price, repairs, closing costs and rate buydowns, especially with builders. For sellers, it means pricing to the market from day one, because homes that sit tend to get cut later anyway.
Will North Texas home prices crash?
Nothing in the data looks like 2008. Every one of the 77 cities with data is still worth more than it was in January 2020, from +16% in Princeton to +108% in Highland Park. Most owners who bought before 2021 have a lot of equity, and rising inventory has meant slow price cuts, not forced sales. Zillow’s own forecast calls for DFW values to slip another 0.9% over the next 12 months: a slow drift, not a crash.
For perspective, the Princeton buyer who paid the 2022 peak is down about a quarter, while the owner who bought there in 2019 is still up. Timing, not the city, decided who lost money.
Why growth hit prices hardest
Each dot is a city. Population growth over the past five years (Census Bureau estimates, via Realust) vs. typical home value compared with its peak (Zillow, Sept. 2026). Colors match the map.
The cities that added people fastest are, mostly, the cities where values fell most. That sounds backward, but more people usually means more new houses, and that supply is what keeps a lid on prices. It also means many recent buyers stretched to buy at the 2022 top. Close-in cities with little room to grow had the opposite problem: scarcity. Fewer listings kept prices high.
There are exceptions. Copper Canyon and Northlake grew fast too, but their values held up better than other growth towns (-2.4% and -11.3%). For more on where the new houses are going up, see where North Texas is building and the fastest-growing cities.
Luxury vs. starter homes
| City | Starter homes | Typical homes | Upper-end homes |
|---|---|---|---|
| Princeton | -19.9% | -25.8% | -27.7% |
| Prosper | -11.9% | -12.4% | -16.7% |
| Frisco | -10.4% | -9.7% | -10.9% |
| McKinney | -13.0% | -13.6% | -13.4% |
| Plano | -9.3% | -8.8% | -6.8% |
| Dallas | -9.3% | -7.4% | Record high |
| Fairview | -9.4% | -8.4% | -3.3% |
| Flower Mound | -4.6% | -3.3% | -1.3% |
| Lucas | -1.3% | -4.7% | -9.5% |
| Parker | -0.8% | -2.8% | -8.8% |
Zillow Home Value Index by tier: bottom third (5th–35th percentile), middle (35th–65th) and top third (65th–95th) of each city’s homes, each compared with its own peak.
In the newer suburbs, bigger and pricier homes fell more. Prosper‘s upper-end homes are down 16.7%, compared with 11.9% for its starter homes. In Dallas it’s the reverse: upper-end homes are at a record, while starter homes are down 9.3%. In the estate towns, like Lucas and Parker, starter homes held almost flat while the top end slipped.
Home values fell. Why didn’t my property tax bill?
This is one of the most-searched questions in North Texas right now, as 2026 tax bills arrive. Three reasons:
- Timing. Appraisal districts value homes as of Jan. 1. Your 2026 bill is based on a value set early this year, from sales in 2025.
- The homestead cap. In Texas, the taxable value of a homestead can rise no more than 10% a year. If your capped value was below market, it can keep rising each year, even while market prices fall, until it catches up.
- Rates. Your bill is the taxable value times the combined rate of your city, county, school district and any special districts, and many of those rates changed in 2026.
If your home’s market value is now lower than your appraisal notice, a protest can lower it. Notices typically arrive in April, and the deadline is usually May 15. See North Texas property taxes, explained for rates by city and how to protest.
All 84 cities: home values from peak to now
| City | County | Typical value | Peak value | Peak month | vs. peak | 1 year | Since Jan. 2020 |
|---|---|---|---|---|---|---|---|
| Princeton | Collin | $283,150 | $381,709 | Aug. 2022 | -25.8% | -9.8% | +16% |
| Lavon | Collin | $343,123 | $448,622 | July 2022 | -23.5% | -7.3% | +20% |
| Anna | Collin | $337,484 | $429,954 | July 2022 | -21.5% | -6.7% | +26% |
| Cross Roads | Denton | $327,130 | $412,947 | July 2022 | -20.8% | -6.0% | +28% |
| Little Elm | Denton | $390,812 | $478,431 | July 2022 | -18.3% | -5.3% | +32% |
| Melissa | Collin | $422,481 | $516,496 | July 2022 | -18.2% | -5.4% | +37% |
| Royse City | Rockwall | $308,801 | $376,981 | Aug. 2022 | -18.1% | -4.4% | +24% |
| Celina | Collin | $512,080 | $621,975 | July 2022 | -17.7% | -8.9% | +43% |
| Fate | Rockwall | $354,679 | $423,730 | Aug. 2022 | -16.3% | -3.4% | +30% |
| Aubrey | Denton | $337,555 | $401,757 | Aug. 2022 | -16.0% | -7.1% | +29% |
| Farmersville | Collin | $325,317 | $379,464 | Aug. 2022 | -14.3% | -4.4% | +31% |
| Ponder | Denton | $308,766 | $358,600 | Aug. 2022 | -13.9% | -3.7% | +31% |
| Pilot Point | Denton | $318,845 | $370,523 | Aug. 2022 | -13.9% | -5.5% | +29% |
| McKinney | Collin | $472,867 | $547,568 | July 2022 | -13.6% | -5.1% | +42% |
| Wylie | Collin | $415,847 | $478,450 | July 2022 | -13.1% | -5.3% | +36% |
| Prosper | Collin | $760,369 | $868,352 | July 2022 | -12.4% | -5.1% | +57% |
| Justin | Denton | $363,503 | $414,467 | Aug. 2022 | -12.3% | -3.0% | +37% |
| Argyle | Denton | $598,121 | $680,508 | July 2022 | -12.1% | -2.6% | +43% |
| Krum | Denton | $328,782 | $373,088 | Aug. 2022 | -11.9% | -2.8% | +35% |
| Balch Springs | Dallas | $218,725 | $247,970 | Aug. 2022 | -11.8% | -3.2% | +32% |
| Haslet | Denton | $383,646 | $434,230 | Aug. 2022 | -11.6% | -2.6% | +33% |
| Hutchins | Dallas | $244,349 | $276,476 | April 2024 | -11.6% | -3.5% | +40% |
| Northlake | Denton | $488,319 | $550,364 | Aug. 2022 | -11.3% | -3.2% | +37% |
| Denton | Denton | $343,177 | $386,754 | Aug. 2022 | -11.3% | -3.1% | +35% |
| Allen | Collin | $487,619 | $547,405 | July 2022 | -10.9% | -5.1% | +43% |
| Lowry Crossing | Collin | $377,540 | $422,835 | July 2022 | -10.7% | -5.0% | +41% |
| Mesquite | Dallas | $256,597 | $284,388 | Sept. 2022 | -9.8% | -2.1% | +34% |
| Frisco | Collin | $640,131 | $708,535 | July 2022 | -9.7% | -3.9% | +52% |
| Garland | Dallas | $280,515 | $309,419 | May 2024 | -9.3% | -2.9% | +35% |
| Wilmer | Dallas | $219,011 | $240,808 | April 2024 | -9.1% | -2.0% | +51% |
| Seagoville | Dallas | $267,777 | $294,360 | Aug. 2022 | -9.0% | -2.5% | +41% |
| Cedar Hill | Dallas | $311,250 | $341,615 | Aug. 2022 | -8.9% | -0.9% | +39% |
| Glenn Heights | Dallas | $326,270 | $358,052 | Aug. 2022 | -8.9% | -2.5% | +40% |
| Plano | Collin | $497,714 | $545,864 | May 2024 | -8.8% | -3.3% | +41% |
| Rowlett | Dallas | $362,534 | $397,447 | Aug. 2022 | -8.8% | -2.5% | +38% |
| Lancaster | Dallas | $269,301 | $294,886 | Aug. 2022 | -8.7% | -1.8% | +41% |
| Corinth | Denton | $404,856 | $442,878 | Aug. 2022 | -8.6% | -2.0% | +39% |
| Ferris | Dallas | $289,047 | $316,268 | Aug. 2022 | -8.6% | -0.6% | +30% |
| New Hope | Collin | $438,474 | $479,318 | Aug. 2022 | -8.5% | -0.2% | +44% |
| Fairview | Collin | $651,318 | $711,071 | May 2024 | -8.4% | -4.3% | +41% |
| DeSoto | Dallas | $319,395 | $347,427 | Aug. 2022 | -8.1% | -1.2% | +38% |
| Sachse | Dallas | $428,346 | $465,345 | May 2024 | -8.0% | -2.8% | +41% |
| Roanoke | Denton | $423,154 | $456,727 | Aug. 2022 | -7.4% | -0.9% | +41% |
| Dallas | Dallas | $303,442 | $327,521 | May 2024 | -7.4% | -1.4% | +33% |
| The Colony | Denton | $395,343 | $426,291 | Nov. 2024 | -7.3% | -2.5% | +42% |
| Sanger | Denton | $351,346 | $378,596 | Aug. 2022 | -7.2% | -1.7% | +40% |
| Lewisville | Denton | $384,345 | $413,827 | Nov. 2024 | -7.1% | -2.4% | +36% |
| Carrollton | Dallas | $396,178 | $424,957 | May 2024 | -6.8% | -1.4% | +39% |
| Cockrell Hill | Dallas | $208,449 | $223,343 | Nov. 2022 | -6.7% | +0.1% | +41% |
| Van Alstyne | Collin | $421,760 | $450,045 | Aug. 2022 | -6.3% | -3.1% | +42% |
| Nevada | Collin | $398,776 | $425,264 | July 2022 | -6.2% | -1.8% | +43% |
| Grand Prairie | Dallas | $312,607 | $333,119 | Aug. 2022 | -6.2% | -1.2% | +41% |
| Rockwall | Rockwall | $472,474 | $502,588 | Aug. 2022 | -6.0% | -0.9% | +44% |
| Irving | Dallas | $337,610 | $355,329 | May 2024 | -5.0% | -0.1% | +39% |
| Duncanville | Dallas | $272,675 | $286,926 | May 2024 | -5.0% | -0.2% | +41% |
| Lucas | Collin | $1,052,016 | $1,103,560 | July 2022 | -4.7% | -0.4% | +64% |
| Lake Dallas | Denton | $340,062 | $355,776 | Aug. 2022 | -4.4% | -0.6% | +45% |
| Trophy Club | Denton | $685,654 | $715,650 | Jan. 2025 | -4.2% | -0.6% | +54% |
| Richardson | Collin | $437,432 | $455,125 | June 2024 | -3.9% | +0.6% | +43% |
| Addison | Dallas | $499,576 | $518,354 | Feb. 2025 | -3.6% | -0.6% | +38% |
| Flower Mound | Denton | $599,753 | $620,081 | Jan. 2025 | -3.3% | -0.0% | +50% |
| Highland Village | Denton | $582,671 | $601,752 | Jan. 2025 | -3.2% | +0.5% | +48% |
| Coppell | Dallas | $608,310 | $627,094 | Feb. 2025 | -3.0% | -0.0% | +49% |
| Heath | Rockwall | $706,251 | $727,703 | July 2022 | -2.9% | -0.7% | +52% |
| Farmers Branch | Dallas | $374,473 | $385,565 | May 2024 | -2.9% | +1.2% | +40% |
| Parker | Collin | $1,088,753 | $1,119,596 | Jan. 2025 | -2.8% | -1.4% | +64% |
| Copper Canyon | Denton | $1,023,353 | $1,048,861 | May 2025 | -2.4% | -1.1% | +68% |
| Sunnyvale | Dallas | $634,309 | $648,304 | May 2024 | -2.2% | +0.6% | +49% |
| Blue Ridge | Collin | $426,165 | $433,800 | March 2025 | -1.8% | +1.2% | +61% |
| Combine | Dallas | $401,610 | $407,278 | March 2026 | -1.4% | +1.9% | +50% |
| Ovilla | Dallas | $496,141 | $501,247 | Feb. 2025 | -1.0% | +0.2% | +47% |
| Grapevine | Denton | $548,940 | $549,787 | Jan. 2025 | -0.2% | +2.4% | +52% |
| University Park | Dallas | $2,470,693 | $2,470,693 | Sept. 2026 | Record high | +8.7% | +99% |
| Bartonville | Denton | $1,411,294 | $1,411,294 | Sept. 2026 | Record high | +4.0% | +86% |
| Highland Park | Dallas | $3,034,876 | $3,034,876 | Sept. 2026 | Record high | +7.5% | +108% |
| Double Oak | Denton | $850,254 | $850,254 | Sept. 2026 | Record high | +3.7% | +64% |
| St. Paul | Collin | $581,285 | $581,285 | Sept. 2026 | Record high | +2.0% | +59% |
| McLendon-Chisholm | Rockwall | Not enough sales for Zillow’s city index | |||||
| Lantana | Denton | Not enough sales for Zillow’s city index | |||||
| Shady Shores | Denton | Not enough sales for Zillow’s city index | |||||
| Providence Village | Denton | Not enough sales for Zillow’s city index | |||||
| Mobile City | Rockwall | Not enough sales for Zillow’s city index | |||||
| Westminster | Collin | Not enough sales for Zillow’s city index | |||||
| Oak Point | Denton | Not enough sales for Zillow’s city index | |||||
Typical value = Zillow Home Value Index (all homes, middle tier, smoothed and seasonally adjusted), Sept. 2026. Peak = highest month since Jan. 2018. Tap a column to sort.
What this means for you
- Buying: You have leverage, especially in the cities shaded darkest on the map. Ask for seller-paid closing costs or a rate buydown, compare builder incentives against resale, and run the payment, not just the price. A rate buydown can save more each month than a bigger price cut.
- Selling: Price against today’s sales, not 2022’s. In cities still near their peak, you’re in a stronger spot. In cities down 15% or more, your buyer has a lot of new homes to choose from.
- Staying put: If you bought before 2021, you almost certainly have more equity than when you bought. Keep an eye on your Jan. 1 appraisal and protest if it’s above market.
- Choosing a city: Price trends are only one input. Compare schools, safety, commute and taxes for any two cities with Realust Compare, or start with the best places to live in North Texas.
Graphics you can share
Free to share or embed with credit to Realust (realust.com). Tap an image to open the full size.
Frequently asked questions
Are home prices dropping in North Texas?
Yes, in most cities. The typical DFW-area home was worth $358,242 in Sept. 2026, 8.6% below the Aug. 2022 peak and 2.0% lower than a year earlier (Zillow). 71 of the 77 cities we track are more than 1% below their peak, while 5 are at record highs.
Which North Texas cities have seen the biggest home price drops?
Princeton (−25.8%), Lavon (−23.5%), Anna (−21.5%), Cross Roads (−20.8%), Little Elm (−18.3%), Melissa (−18.2%), Royse City (−18.1%) and Celina (−17.7%), each from its summer 2022 peak to Sept. 2026, according to the Zillow Home Value Index.
Which cities held their value best?
Highland Park, University Park, Bartonville, Double Oak and St. Paul were at record highs in Sept. 2026, and Grapevine was within 1%. Ovilla, Combine, Blue Ridge, Sunnyvale, Copper Canyon, Parker, Farmers Branch, Heath, Coppell, Highland Village and Flower Mound were all within about 3.5% of their peaks.
Is it a buyer's market in Dallas right now?
By most measures, yes. About 34% of DFW listings had a price cut in Sept. 2026, inventory is about double the June 2022 level, homes take about 64 days to go under contract, and the typical home sells for about 2% under list price (Zillow).
Will the housing market crash in 2026?
The data doesn't point to a crash. Every North Texas city we track is still worth more than in January 2020, and Zillow's forecast calls for DFW values to change -0.9% over the 12 months to Sept. 2027, a slow drift rather than a sharp drop.
Why are Texas home prices cooling?
Mostly higher mortgage rates and more supply. The 30-year rate rose from under 3% in 2021 to 7.24% in late October 2026, which shrinks buying power, and DFW builders added thousands of new homes, so inventory has roughly doubled since 2022.
Will home prices go down in 2027?
Zillow expects DFW values to change -0.9% between Sept. 2026 and Sept. 2027, versus +1.1% nationally. Forecasts can be wrong, and the biggest swing factor is mortgage rates.
Why didn't my property taxes go down if home values fell?
Texas appraisal districts value homes as of Jan. 1, so bills lag the market. A homestead's taxable value can rise up to 10% a year until it catches up with market value, and tax rates also change each year. If your appraisal is above market, you can protest it, usually by May 15.
How we did this
Home values are the Zillow Home Value Index (ZHVI) for each city: the typical home value for all homes (single-family and condos) in the middle price tier, smoothed and seasonally adjusted, through September 2026. “Peak” is each city’s highest monthly value since January 2018. Seven of Realust’s 84 cities (Lantana, McLendon-Chisholm, Mobile City, Oak Point, Providence Village, Shady Shores and Westminster) don’t have a Zillow city index. Zillow uses its own city boundaries, and small towns can swing more because they have fewer sales. Mortgage rates are Freddie Mac’s weekly Primary Mortgage Market Survey, via the St. Louis Fed (FRED). Population growth is the five-year change used in Realust’s city scores. Payment estimates are principal and interest only, with 10% down on a 30-year fixed loan. This article is for information, not financial advice.
Sources
- Zillow Research data: Home Value Index (city and metro, all tiers), listings with price cuts, inventory, days to pending, sale-to-list ratio, new-construction sales, home value forecast
- Freddie Mac 30-year fixed rate mortgage average (FRED, St. Louis Fed)
- Fox Business: Mortgage rates rise for seventh straight week (Oct. 8, 2026)
- U.S. Census Bureau TIGERweb: city and county boundaries, roads
- Texas Comptroller: property tax basics, appraisal and protests